Day 110 in MIT Sloan Fellows Class 2023, Introduction to System Dynamics 2 - "The process of modeling"
Summary of "linking" between two components

In a nutshell, you put "plus" for positive causality between two variables, and put "minus" for "negative" causality.
Common mistakes for causal loops
When we set up a variable, the common mistakes are as follows.
- Variable names should be unambiguous
- Names should have clear directionality, but Not imply behaviour
- If you feel the polarity "depends on" the situation, you need to add one more variable.

Modeling process
- Problem statement: "What is the problem?"
- Boundary: List key variables that should be included in your model
- Set timeframe: Identify the time horizons for the behaviour in question
- Draw: Pick a few key variables and draw their reference modes
- Interpret/Digest: Given your reference modes, what types of loops must your model have?
- Structure: Draw the loops that generate the initial growth and the loops that limit the growth.
For example, let's think about Uber .
Model conceptualization
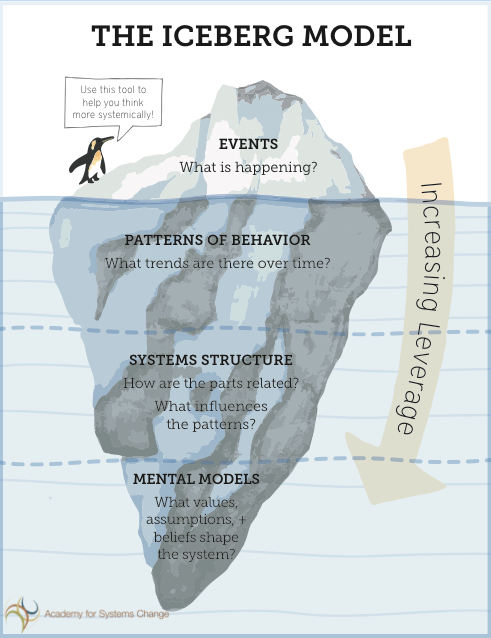
Think deeply and try to build hypothesis about system structure and patterns of behavior from actual events Just like an iceberg, 90% of which is invisible beneath the water, these structures are often hidden below the surface. However, if you can identify them and connect them to the events that you are seeing, you may be able to develop lasting solutions that target the whole system rather than short term, reactive solutions.
List variables
What kind of factors would influence Uber demand? Let's brainstorm!
- Drivers(ppl)
- Users(ppl)
- Competitors(companies)
- Potential users(ppl)
- Ease of use relative to taxi(non-dimensional)
- Price($/mile)
- Frequency to use(usage/month)
- Average mile(mile/usage)
By the way, relative to XX would be extremely common way to create a variable.
Set timeframe
Let's set timeframe. Before and after fiver years from now, Uber's demand and drivers would change?

Are there correlation or causation?
Which increase/decrease earlier than the other?
Asking and answering these questions are an important process to reflect your model.
Draw
Then, you can start by drawing one feedback loop.
